
Gallery
Ocean Flows. Credit: NASA’s Scientific Visualization Studio (MP4, 27.7 MB).
Ocean Flows. Credit: NASA’s Scientific Visualization Studio (MP4, 27.7 MB).
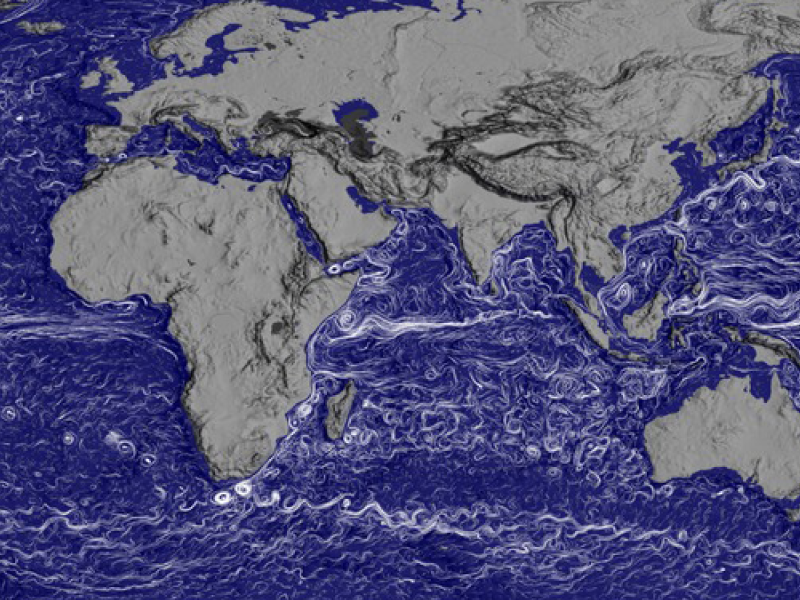
Ocean Flows
[13-Nov-2017] This visualization shows global ocean current flows, first at sea level, then at 2000 meters below sea level, from Jan 01, 2010 to Dec 31, 2012. Notice some of the differences in speed and direction of flow between sea level and 2000 meters below sea level. For example, the Gulf Stream off the coast of Eastern North America flows strongly towards the northeast, while at 2000 meters below sea level, the flow is weaker and in the opposite direction. View a closeup of ocean currents in the North Atlantic over the same time period at NASA's Scientific Visualization Studio. The data used to create this visualization were obtained from GTOPO30 Topography and Bathymetry and the ECCO2 High Resolution Ocean and Sea Ice Model (01/2010-12/2012).Original Media » Click on the image to play the movie. Click on the Escape key or anywhere outside the shadowbox to close.
To download a copy, right click on the image and select Download Linked File (on a Mac keyboard, click the touchpad while holding down the Control key).