
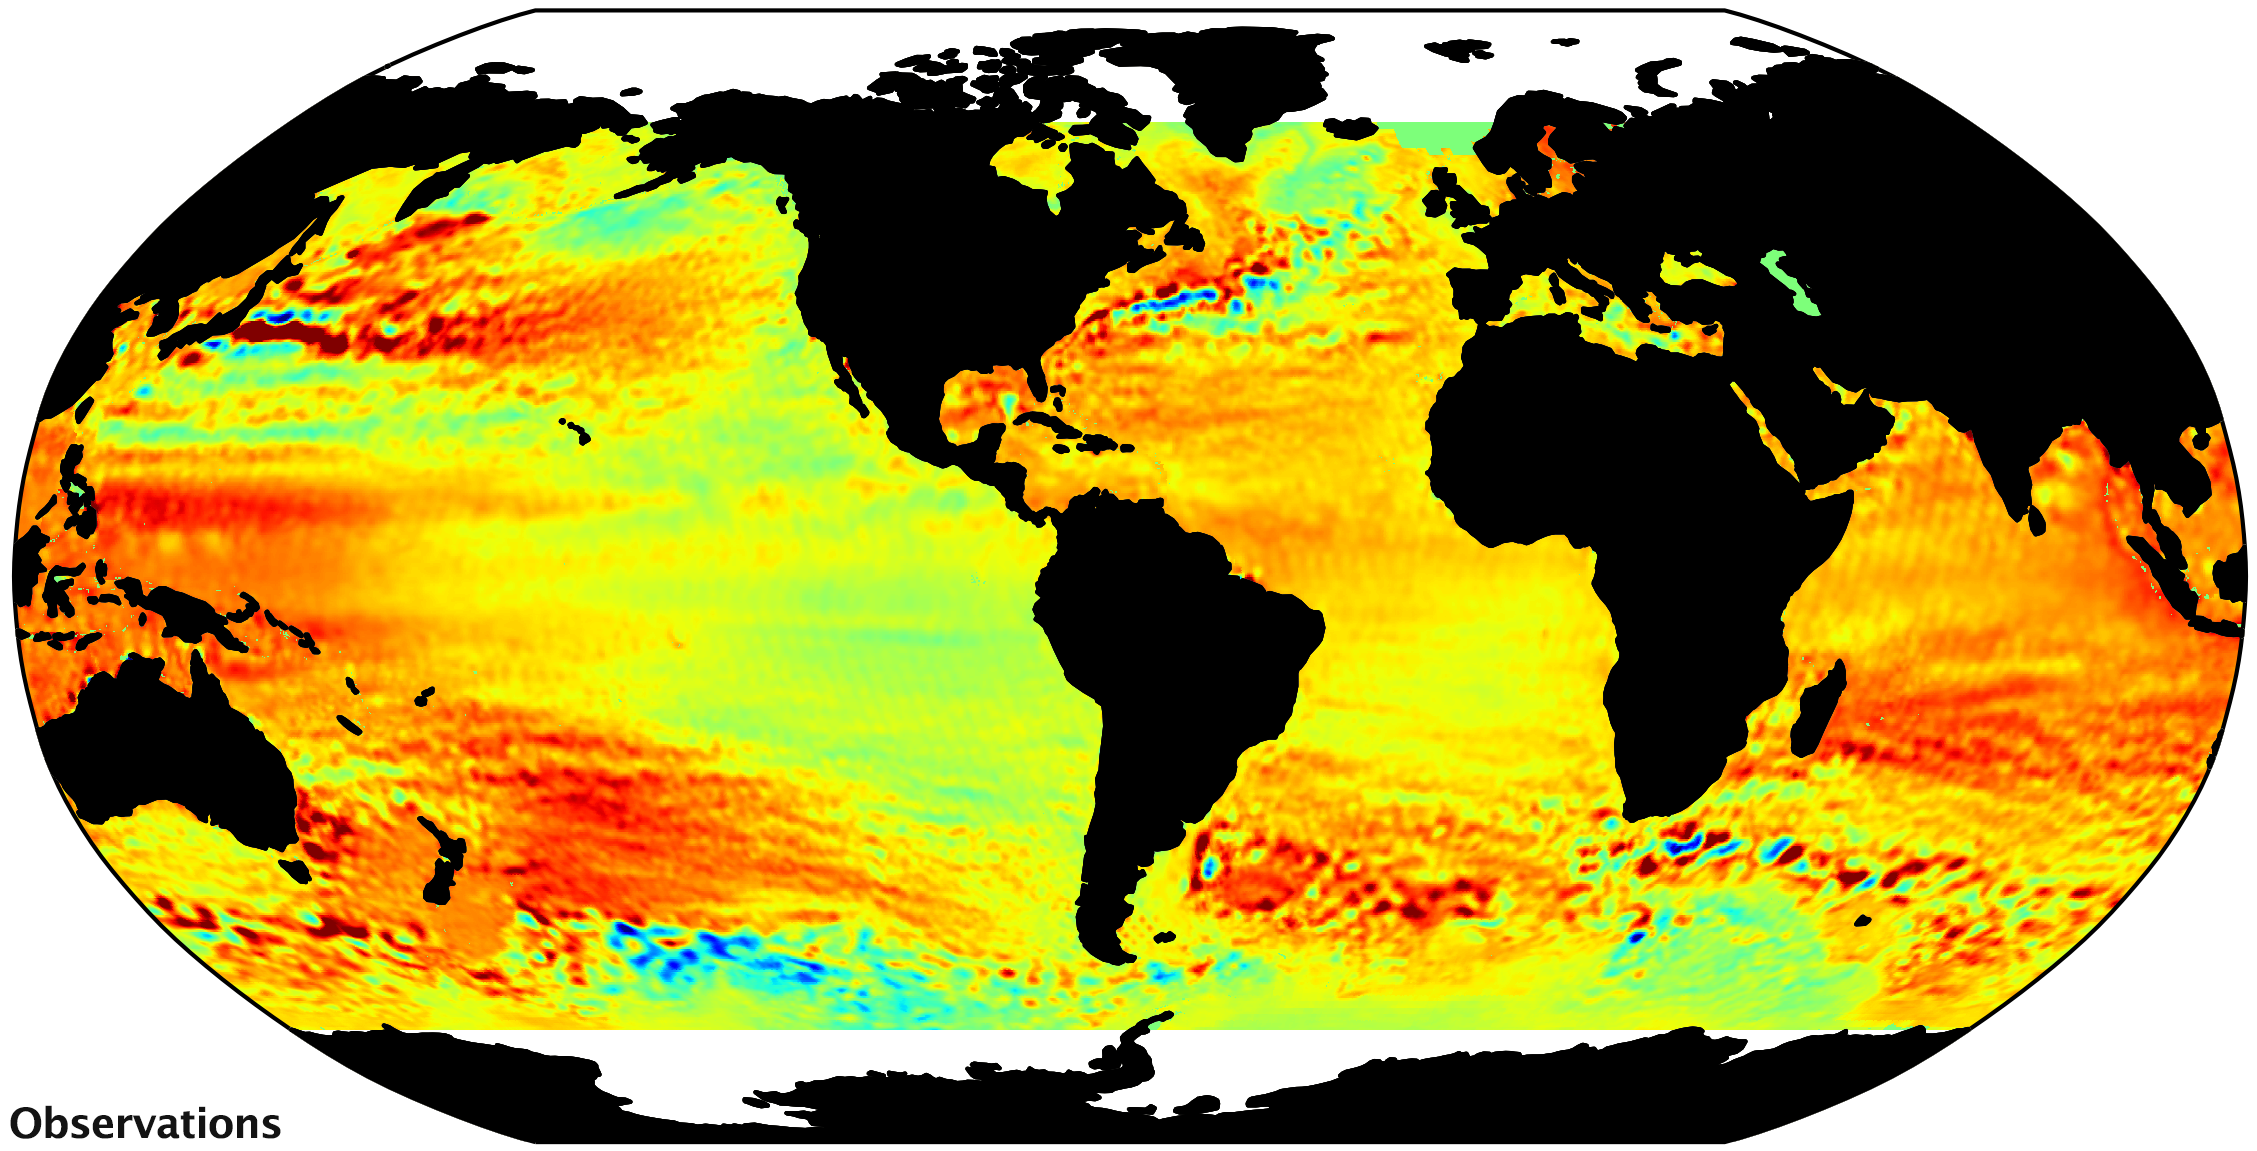
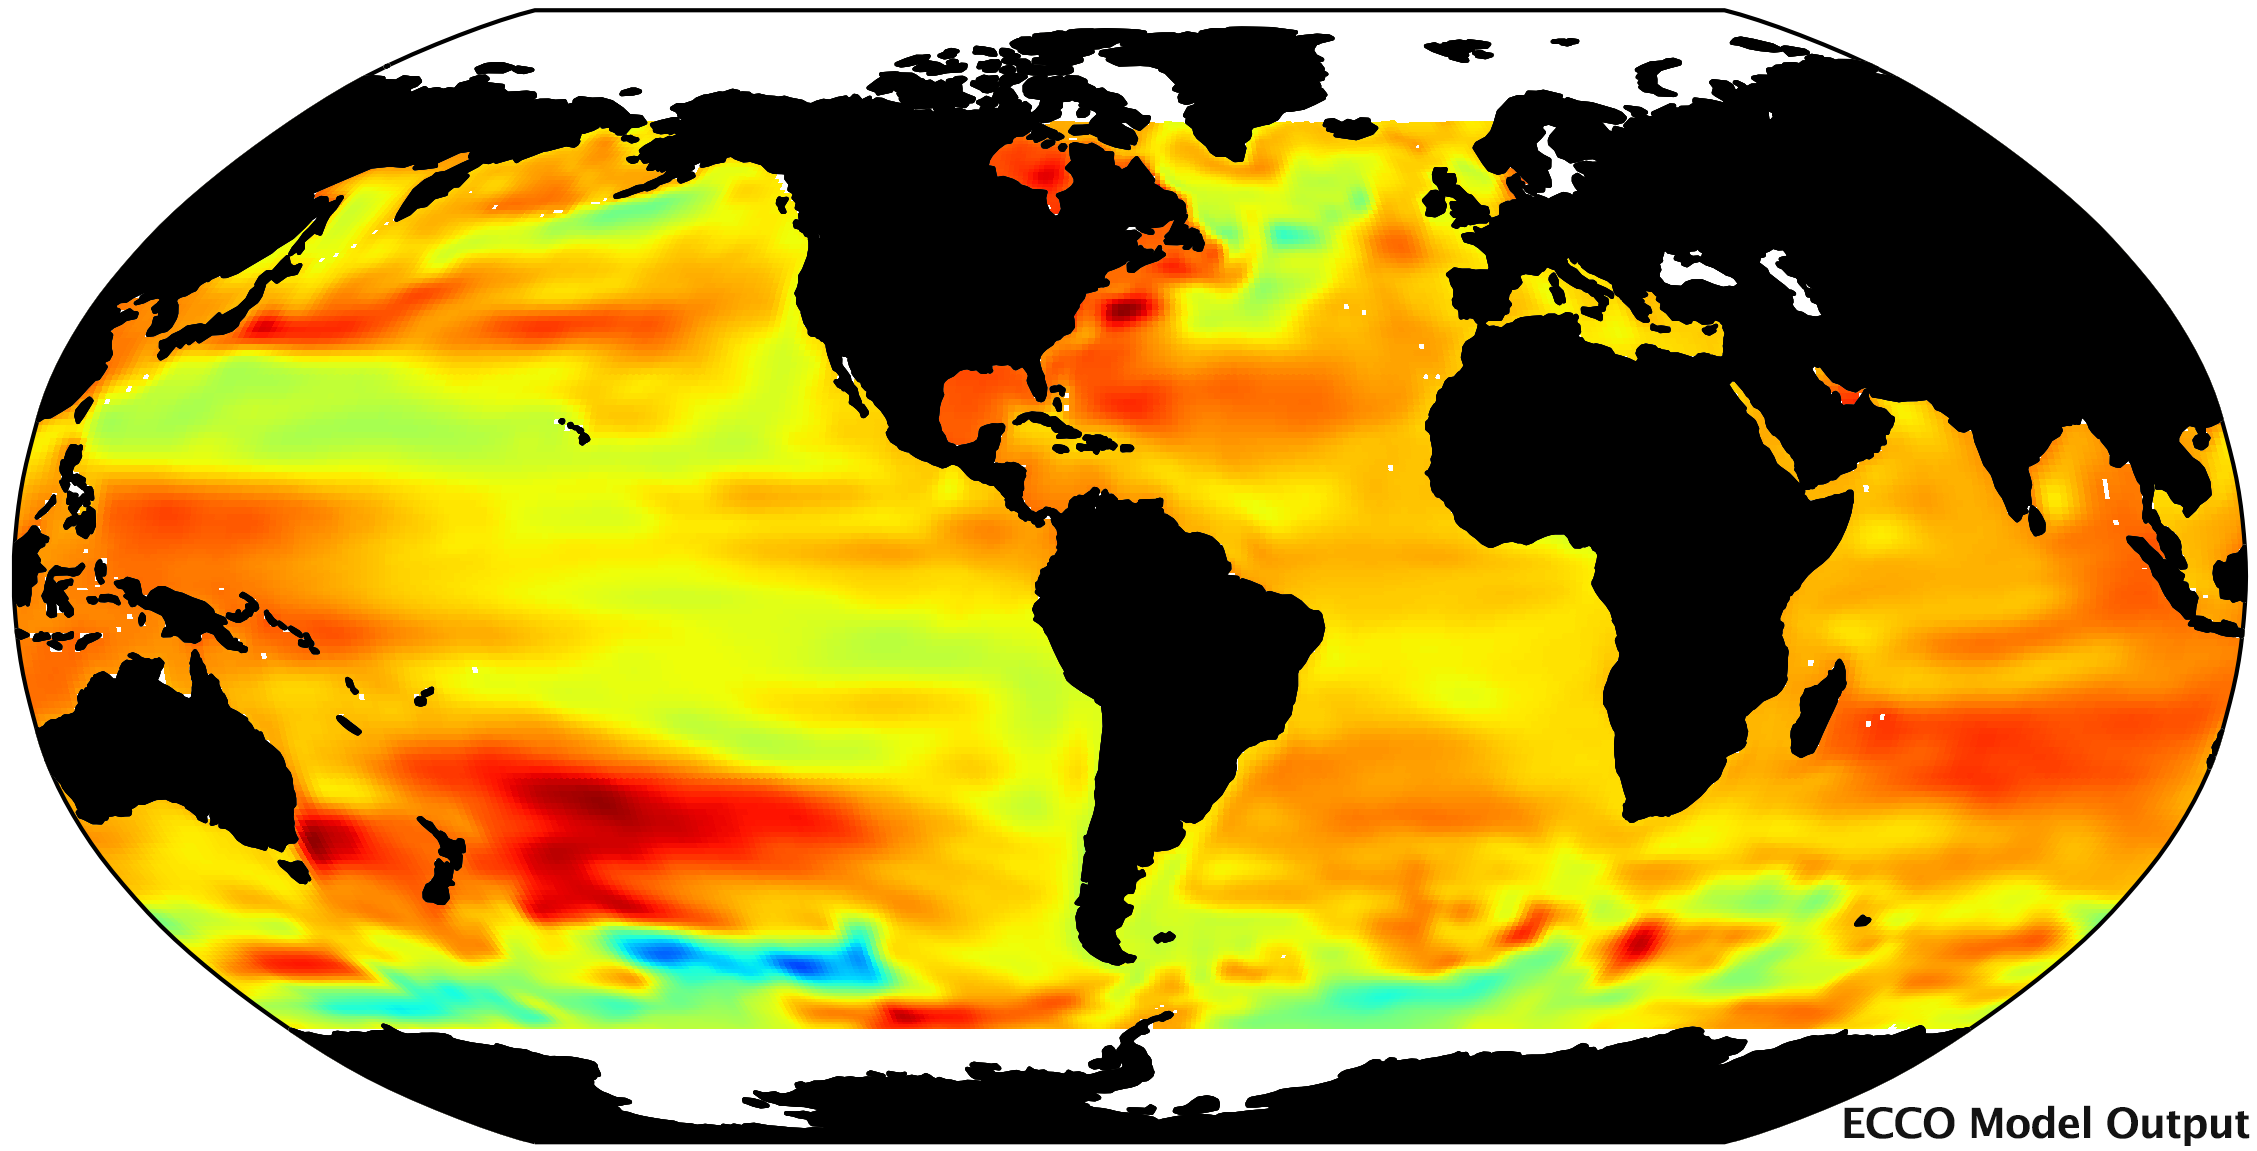
Sea Surface Height Linear Trend: 1993-2017
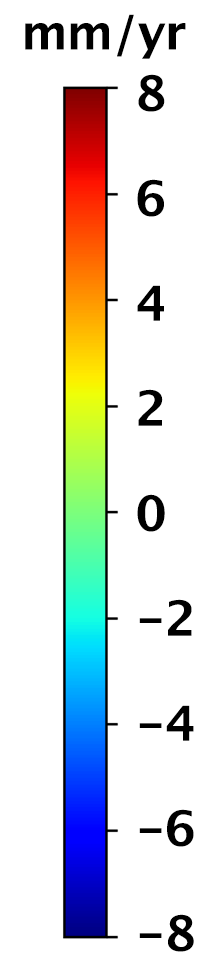
Use the slider to see an example of the fidelity of ECCO to observations. At left are observations from satellite altimetry missions. At right is the ECCO Version 4 model output based on the same time period, covering the latitude range of NASA altimeter missions (i.e., from 66°N to 66°S). The dominance of red, orange, and yellow colors indicates that sea level has been rising over much of the ocean. In some regions, sea level has risen nearly 8 mm per year for decades.
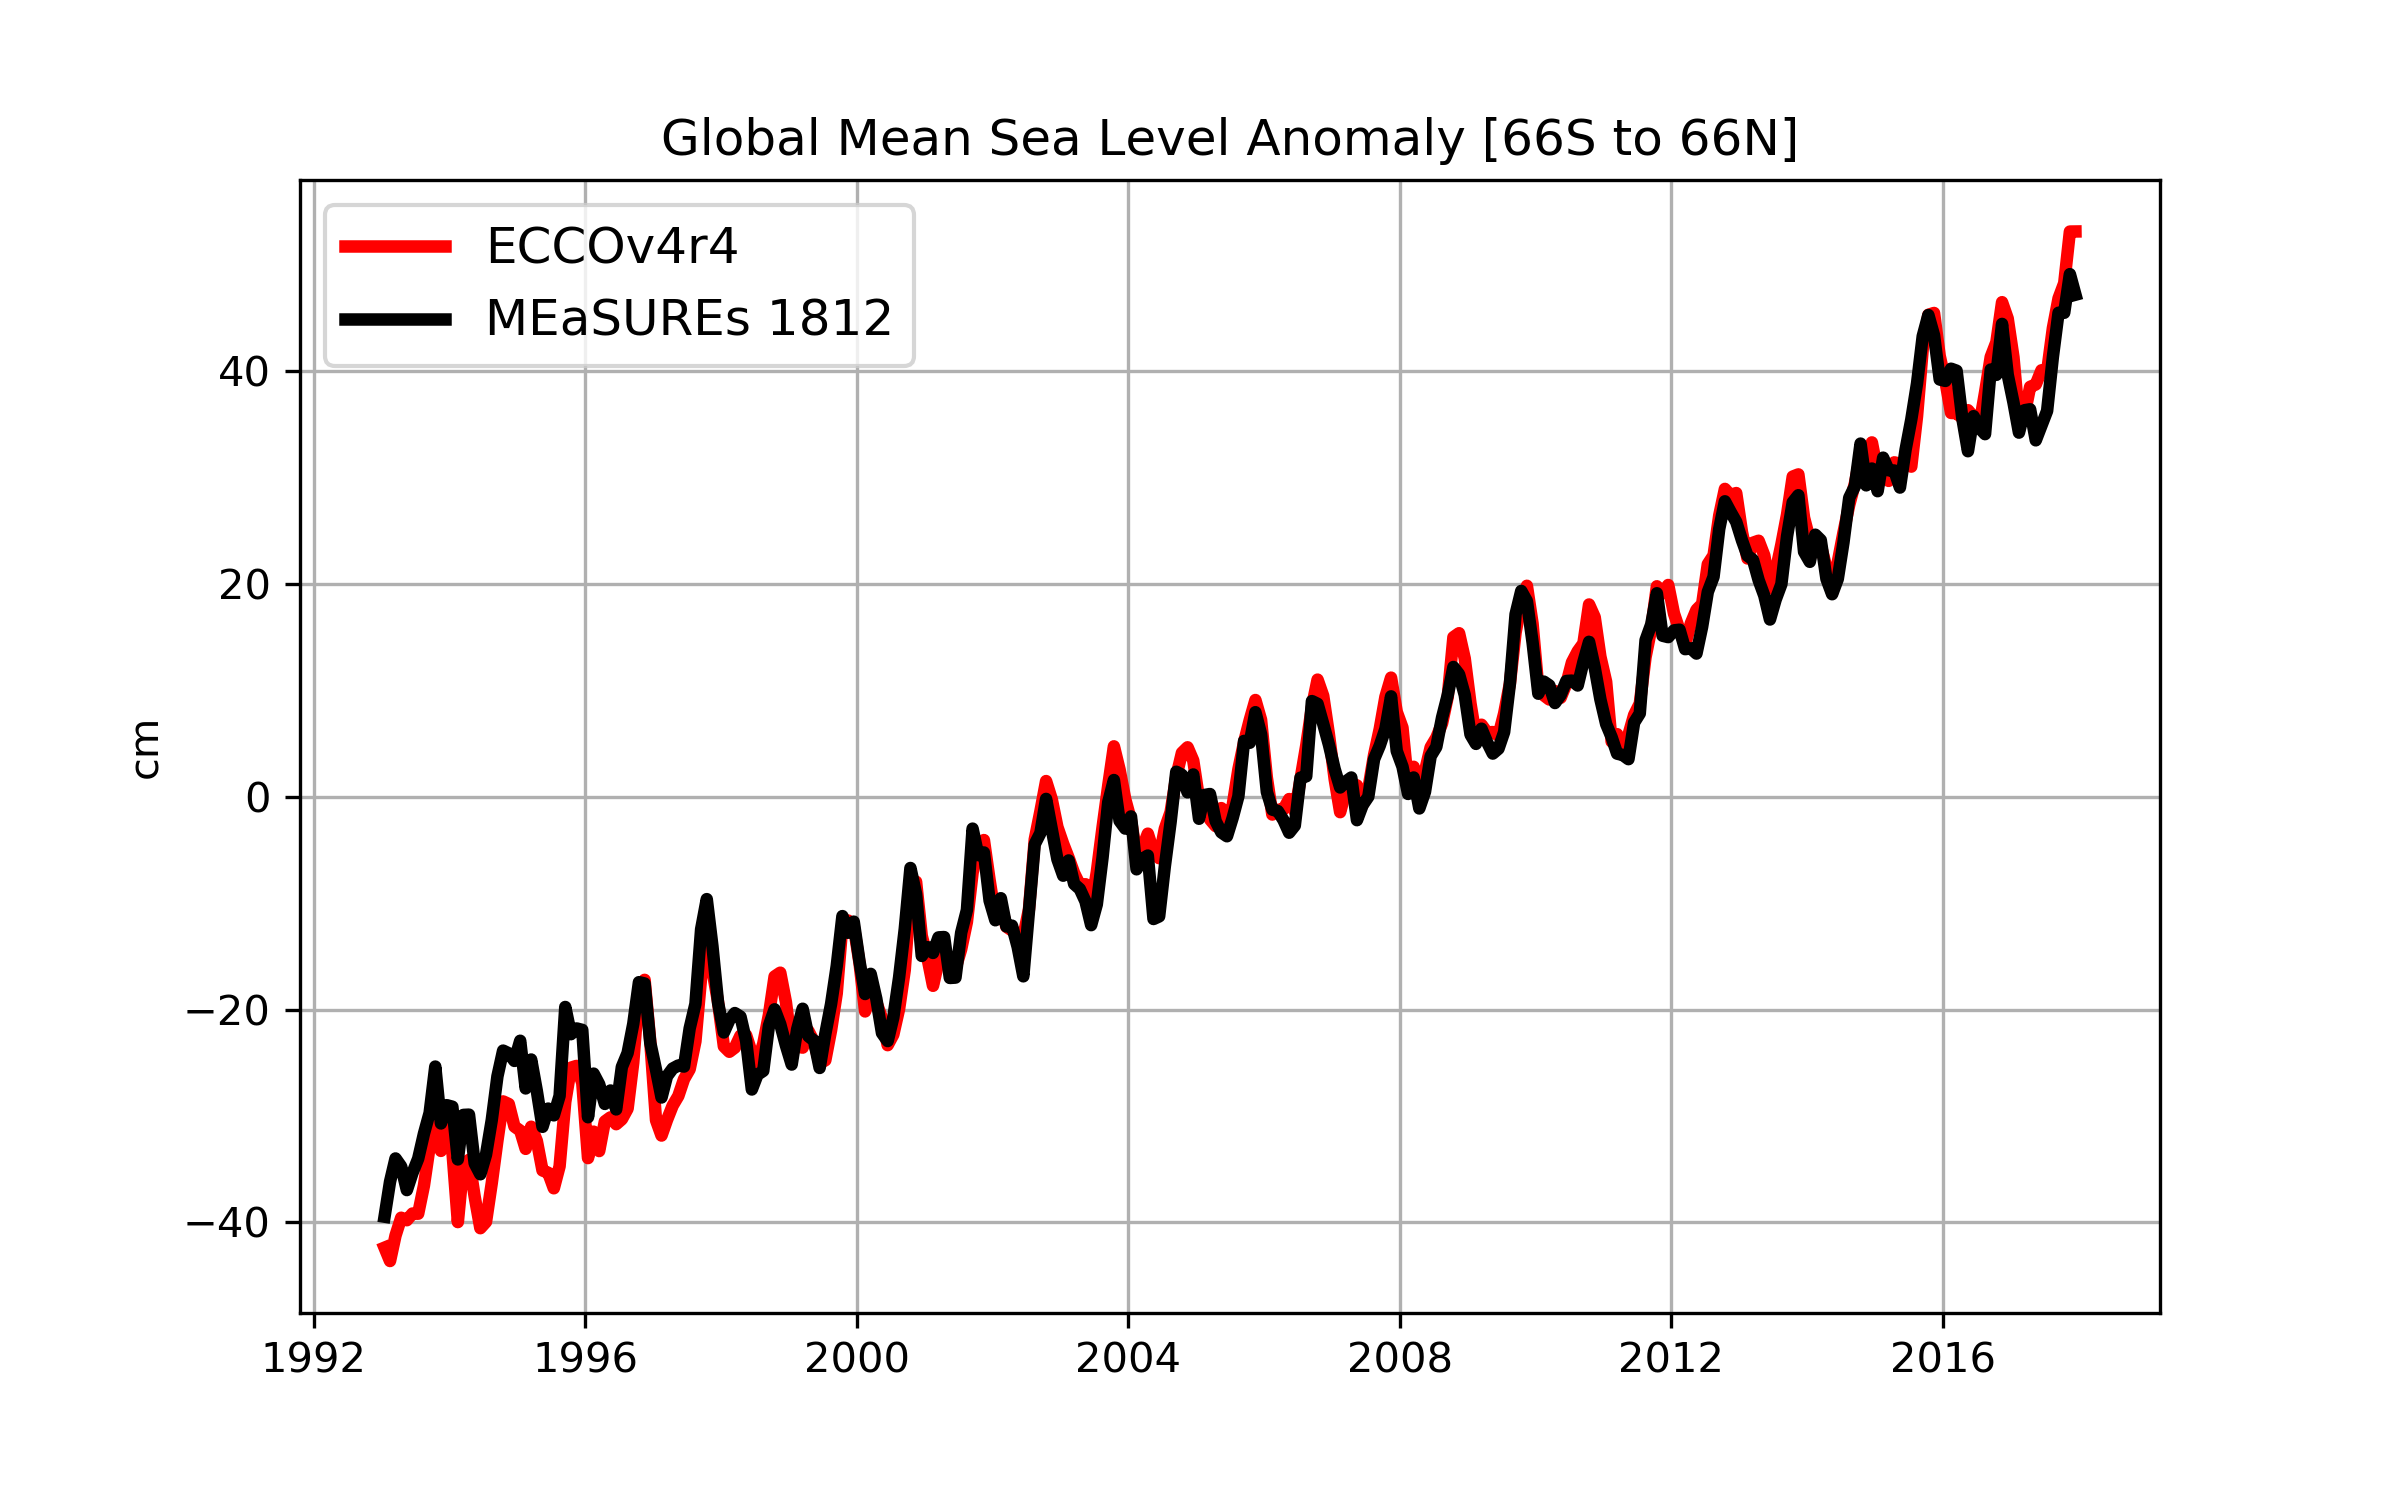
A time series graph compares global mean sea level anomaly from ECCO (V4r4) and satellite altimeters (NASA MEaSUREs Gridded Sea Surface Height Anomalies Version 1812 product) from 1993 to 2017.