
A World of ECCO Visualizations
Thanks to powerful supercomputers, NASA now offers a large suite of visualizations that you can customize in a few easy steps. This page is designed to help you navigate among hundreds of videos and images that have been pre-computed using a 14-month global simulation of the ocean (September 2011 to November 2012).
Visualizations of the ECCO Project's 1/48° MITgcm Simulation
- Visit this URL: Visualizations of the ECCO Project's 1/48° MITgcm Simulation (aka llc4320)
- Choose a series - 5 options
- Choose a measurement type (a.k.a. "Scalar") – 21 options
- Choose a depth (a.k.a. "Level") – 90 options for 3D scalars and 1 option for 2D scalars
- Click on an image to reveal a table with options for your custom visualized data
Series
The series – Global, 8 Regions, 128 Regions, Arctic – offer 2 or 3 options for pixel resolution (in km), each of which corresponds to a specific animation size (in pixels).
| Overview | Ranges of Pixel Spatial Resolution / Animation Sizes for each Series | ||
|---|---|---|---|
| Global | 43 km / 1000 x 600 | 22 km / 2000 x 1200 | 12 km / 3600 x 2160 |
| 8 Regions | 22 km / 800 x 600 | 11 km / 1600 x 1200 | 6 km / 2880 x 2160 |
| 128 Regions | 5.4 km / 800 x 600 | 2.7 km / 1600 x 1200 | |
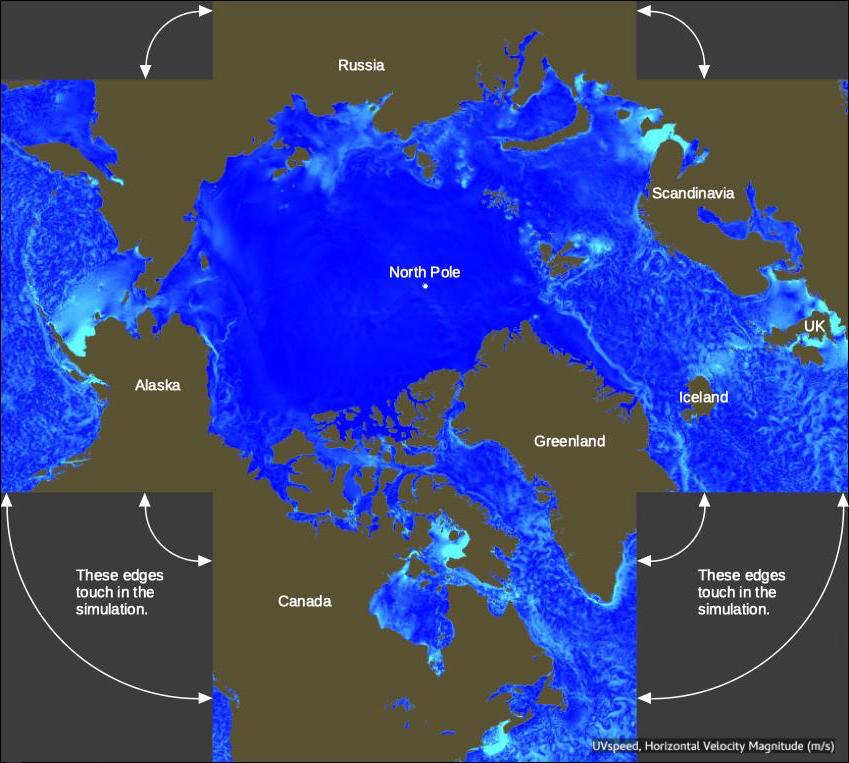
| Arctic - 1 Region | 12 km / 1200 x 1080 | 6 km / 2400 x 2160 | Click here to learn more about Arctic grid projections |
| Arctic - 30 Regions | 3.7 km / 800 x 600 | 1.8 km / 1600 x 1200 | |
Measurement Type & Depth
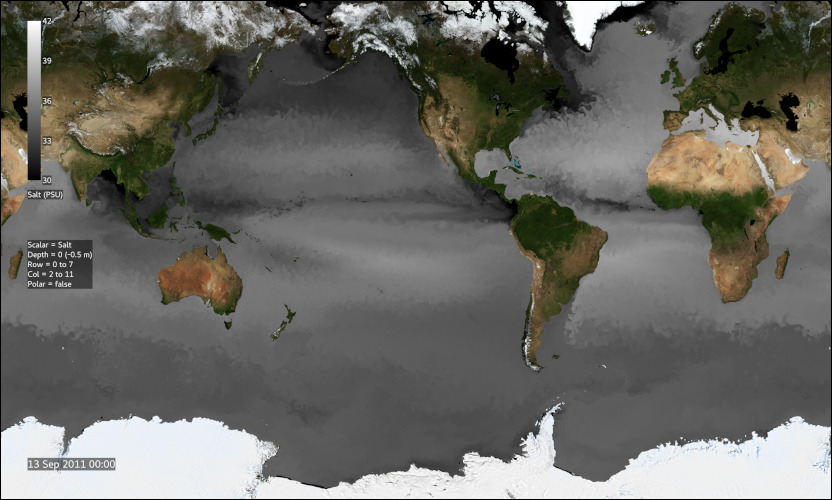
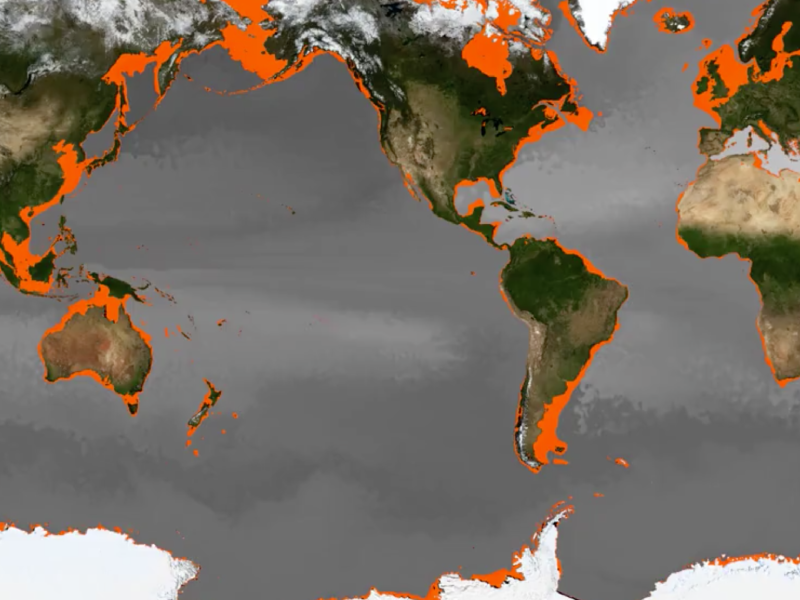
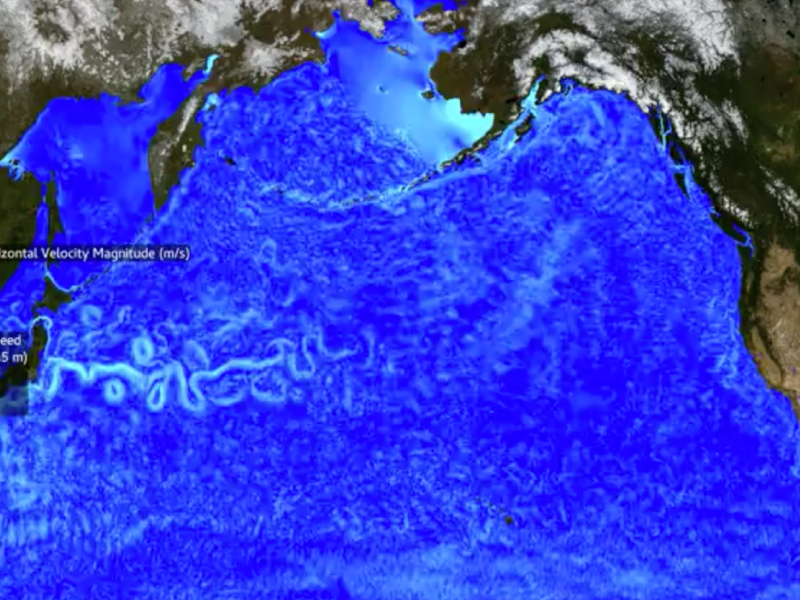
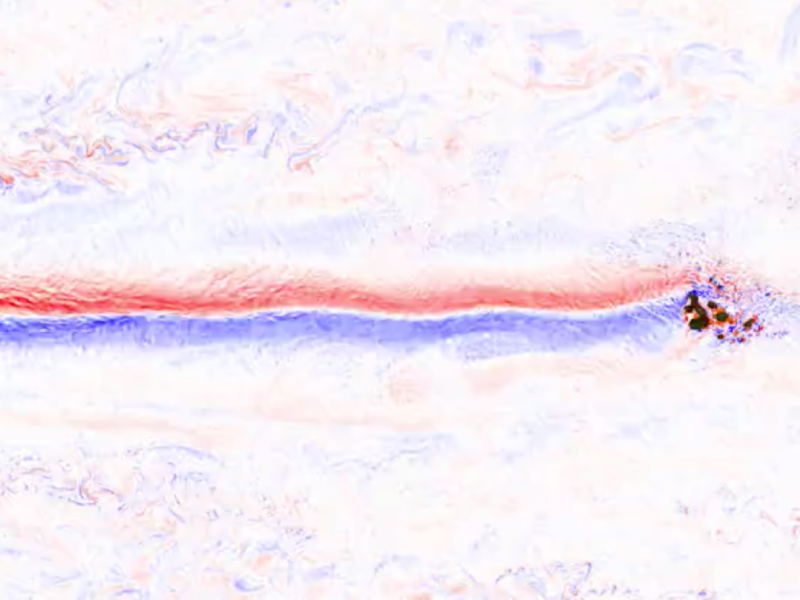
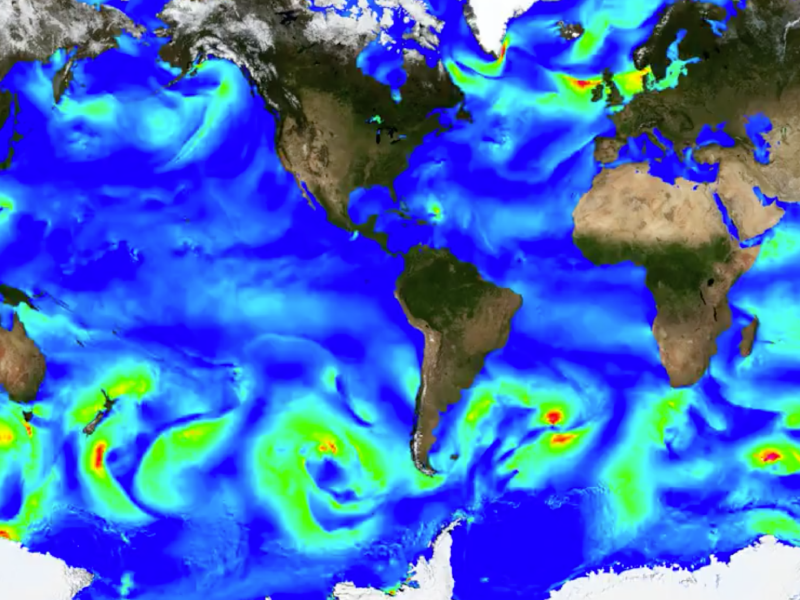
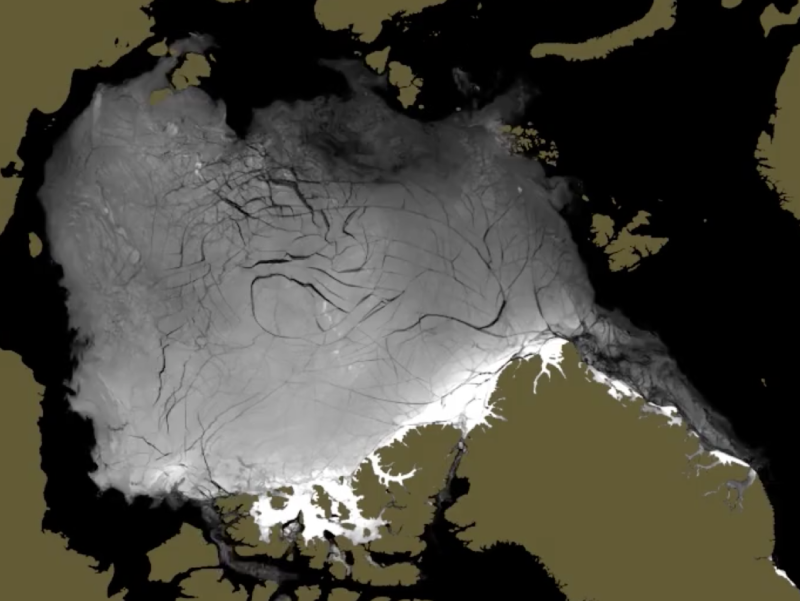
Some measurement types produce more colorful maps than others, as shown below. Measurements are parsed between 3D and 2D options. 3D have 90 ocean depth options. 2D have ocean surface data only (e.g., air-sea fluxes, surface winds).
| 3D Choose one of 90 Levels: 0.5 m to 6301 m depth | |
|---|---|
 |
|
 |
|
 |
|
| 2D One Level only: 0.5 meters depth | |
|---|---|
|
|
 |
|
 |
|
 |
|
 |
|
Visualized Data
After completing the previous steps, a map will appear comprised of 1 (global or Arctic), 8, 30, or 128 images. Clicking on any image will reveal a table with several options.
Click a button to designate the Timestep (row) and Animation Pixel Resolution and File Size (column). Purple arrows below show the general trends in file sizes… specific file size information will be listed in each cell of the table.
Example Visualizations